Calculating unique visitors in Hadoop and HiveSeptember 6, 2011 by Radek Maciaszek
Unique visitors
One of the most important website metrics is the number of unique visitors. However, it is also one of the most difficult to calculate. In this post, I will review a sampling strategy which produces a very good estimate of unique users, yet is computationally cheap.
Non-additive data
It is relatively easy to calculate small numbers of unique visitors: all you need to do is perform a single SQL query.
To calculate the number of unique records in Hive, run the following:
[gist id=1159244]
However, once the number of records in the table “page_views” becomes very large, this query may result in OOM errors. If this happens, there are other ways to calculate the exact number of unique visitors. Alternatively, it is possible to generate useful figures by using a sample.
Sampling
In practice, estimating the unique visitors metric gives pretty close results. In our tests on tens of millions of records, the results came within 0.1% of real values. One thing to remember is to ensure you sample visitors and not page views. The presented sampling method is a simple Bernoulli Sampling.
Having a sample can sometimes be even more useful than calculating the exact number. You can build a data warehouse around the sample and slice and dice on unique visitors — something which cannot be done on pre-calculated non-additive data. I will show at the end of this post how to create a cube that can be used to visualise unique visitors data.
Hashing
In order to sample users, we need to get every n-th user randomly from the population of records. One way to do it is to calculate the visitor hash for every record using a uniform hashing function (such as Md5). Md5 generates a random hexadecimal string on which we can filter only those users whose hash finishes with an arbitrary string, such as ’00’. Notice that since this is a uniform hashing function, the probability that the user hash finishes with ‘0’ is 1/16, and so the probability that it finishes with ’00’ is 1/256.
Note that Hive (at the time of writing, version 0.7) does not implement an Md5 function, so feel free to use the following code to add an Md5 hash function to Hive:
[gist id=1050002]
Alternatively you may patch your Hive distribution with the code from the following ticket HIVE-1262.
HiveQL
The following query will generate a unique visitors sample:
[gist id=1049918]
Pentaho
There are many other issues with unique visitors, such as how to present non-additive results to the end user. BI tools (such as Pentaho Mondrian) allow you to do this with the distinct aggregate function:
[gist id=1159282]
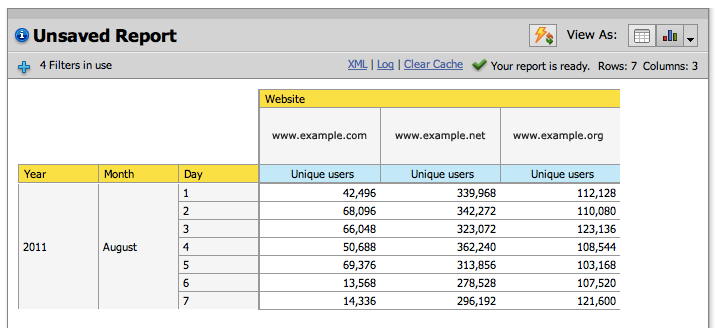
After loading the sample to your aggregate, the OLAP tools will allow you to report on it in a similar way to how you would report on standard additive data. See below:


okay, i understand the hashing and the idea. just for clarity sake are you attaching pentaho directly to HIVE? So, the function created is now part of the HQL that is sourcing the UInique Visitors Cube?
-thanks
robert
When exposing the data in Pentaho I always import first the results into a relational database. Usually that is still quite a big dataset so using columnar databases, such as Infobright, is a good choice. Pentaho talks directly to InfoBright and Hive is used only to create a sample.
Best,
Radek
okay, so you create the table in Infobright, Vertica, or what ever. how are you getting the sample information?
i guess i see the hash function creating a sample data set. so, now how are you adding the browser and date information to that sample data set. are you doing this as part of a hive query and the taking this into your columnar database of choice.
is this the actual strucutre that you are creating in Hive
tables hive_sample
date_key,
browser_key,
user_hash
so, if you wanted unique over more columns do you need to extend the above table. what the sampling gives you at that point is simply the same wdith of table, but thinner.
date_key,
browser_key,
store_key,
user_hash
thanks,
Robert
The sampled data is on the smallest granularity level (individual users). You can easily add here any more columns as required. If you want to count uniques over specific dimension you can select distinct records and group by that dimension. So I think you are right in your assumptions above (if I understand the question correctly).
-Radek
thank you very much.